
Here’s Who Will Win the 2024 Election, According to Financial Markets

It seems like every four years the world stops.
I remember when Trump shocked everyone by beating Hillary in 2016, and then again when Biden knocked Trump off in 2020. I'll never forget the rollercoaster of emotions from family and coworkers—angry, hopeful, relieved, crushed. I give these candidates too much credit. They're just mirrors of us, and not us of them. In many ways, the political market is much like other markets I am so familiar with.
And the uncertainty these elections bring. You've got talking heads running in circles, throwing out predictions based on demographics, sentiment analysis, and fancy statistical models. The whole political process in the U.S. is this wonderfully ridiculous free market built on assumptions—my assumptions, the assumptions of others, and even assumptions about what I think others assume about us. It's as unpredictable as the weather and as impassioned as the stock market.
Since my life's work centers on other people's wealth, I'd better understand just how my neighbors live. Macfarlane Investors takes pride in having clients who represent every slice of our nation. My clients span the political spectrum, representing diverse backgrounds and faiths—from first-time investors to seasoned savers making their final dollars count. I am hyper-focused on how I can build a financial services firm that can confidently and empirically serve every single American, reflected in the logo update I finished earlier this year.

I've been lucky to work with such diverse groups, and I'll tell you this much: most people are good people who care. But a sick truth about capitalism lies in this: bottom lines must be protected, even if it means turning us against each other for ad revenue and shareholder value. Big tech makes hand over fist, and legacy media's even worse. And if you think you're too smart to fall for it—well, studies show intelligent people are actually more likely to double down on confirming their own beliefs. This isn't because they're certain of being right, but because they're overly confident in their ability to prove others wrong.
Before I make my prediction, here's what I believe: America's still the best place to live, work, and invest. We've been #1 in the global power rankings coming up on 300 years running. Let's not let our inability to talk to each other wreck future gains. After you vote, make it a point to find someone with different beliefs. Talk to them, hear their story—and do it with love in your heart.
Introduction: Can the Stock Market Predict Presidential Elections?
In short—yes it can. Dating back to our earliest market data in pre-depression days, the stock market has been an incredibly accurate forecaster of who wins in any given presidential election. The simple rule follows that if the S&P 500 has risen (is positive) in the 3 months preceding November 5th, the incumbent candidate (or party) will win. If the market is flat or has fallen, the incumbent party will lose, and a new candidate will take office.
Economic market indicators have also been valuable soothsayers towards the outcome of elections. Generally, when the Misery Index, a gauge of inflation and unemployment, rises above 10%, it spells bad news for the incumbent president. My prediction centers around a combination of these two, which are detailed much further below.
Historical Accuracy of the Stock Market as an Election Predictor
In the 24 presidential elections held since 1928, stock market performance has predicted the winner with 87.5% accuracy, or 21 out of 24 instances. The indicator has never been incorrect in consecutive elections and enjoyed a 14-election winning streak from 1956 to 2012. It was most recently incorrect in 2020 when Joe Biden defeated incumbent president Donald Trump, despite the S&P 500 being up in the quarter before the election. A full breakdown of the indicator's historical signals is detailed below, along with summary statistics and notable exceptions.
Detailed Election Data from 1928 to 2020
| Year | S&P 500 Performance % Change from July 31 to Oct 31 | Market Direction | Incumbent Party | Incumbent Candidate | Challenging Party | Challenging Candidate | Winning Party |
|---|---|---|---|---|---|---|---|
| 1928 | 13.6% | Up | Republican | Herbert Hoover | Democratic | Al Smith | Republican |
| 1932 | -2.6% | Down | Republican | Herbert Hoover | Democratic | Franklin D. Roosevelt | Democratic |
| 1936 | 7.7% | Up | Democratic | Franklin D. Roosevelt | Republican | Alf Landon | Democratic |
| 1940 | 0.3% | Up | Democratic | Franklin D. Roosevelt | Republican | Wendell Willkie | Democratic |
| 1944 | 2.2% | Up | Democratic | Franklin D. Roosevelt | Republican | Thomas E. Dewey | Democratic |
| 1948 | 5.0% | Up | Democratic | Harry S. Truman | Republican | Thomas E. Dewey | Democratic |
| 1952 | -3.3% | Down | Democratic | Adlai Stevenson | Republican | Dwight D. Eisenhower | Republican |
| 1956 | 0.9% | Up | Republican | Dwight D. Eisenhower | Democratic | Adlai Stevenson | Republican |
| 1960 | -0.7% | Down | Republican | Richard Nixon | Democratic | John F. Kennedy | Democratic |
| 1964 | 2.6% | Up | Democratic | Lyndon B. Johnson | Republican | Barry Goldwater | Democratic |
| 1968 | -4.0% | Down | Democratic | Hubert H. Humphrey | Republican | Richard Nixon | Republican |
| 1972 | 3.0% | Up | Republican | Richard Nixon | Democratic | George McGovern | Republican |
| 1976 | 5.5% | Up | Republican | Gerald Ford | Democratic | Jimmy Carter | Democratic |
| 1980 | -4.2% | Down | Democratic | Jimmy Carter | Republican | Ronald Reagan | Republican |
| 1984 | 8.4% | Up | Republican | Ronald Reagan | Democratic | Walter Mondale | Republican |
| 1988 | 1.9% | Up | Republican | George H.W. Bush | Democratic | Michael Dukakis | Republican |
| 1992 | 1.9% | Up | Republican | George H.W. Bush | Democratic | Bill Clinton | Democratic |
| 1996 | 8.2% | Up | Democratic | Bill Clinton | Republican | Bob Dole | Democratic |
| 2000 | -4.3% | Down | Democratic | Al Gore | Republican | George W. Bush | Republican |
| 2004 | 2.2% | Up | Republican | George W. Bush | Democratic | John Kerry | Republican |
| 2008 | -19.5% | Down | Republican | John McCain | Democratic | Barack Obama | Democratic |
| 2012 | 2.5% | Up | Democratic | Barack Obama | Republican | Mitt Romney | Democratic |
| 2016 | -1.9% | Down | Democratic | Hillary Clinton | Republican | Donald Trump | Republican |
| 2020 | 4.6% | Up | Republican | Donald Trump | Democratic | Joe Biden | Democratic |
Summary Statistics
- Total Elections Analyzed: 24 (from 1928 to 2020)
- Correct Predictions: 21
- Incorrect Predictions: 3
- Accuracy Rate: Approximately 87.5%
Longest Winning and Losing Streaks
- Longest Winning Streak: The predictor was accurate for 14 consecutive elections from 1956 to 2012
- Longest Losing Streak: The predictor has never been incorrect in consecutive elections; the longest losing streak is one election
Notable Exceptions
1976 Election:
- S&P 500 Performance: Up 5.5%
- Prediction: Incumbent Republican President Gerald Ford should have won
- Outcome: Democratic challenger Jimmy Carter won
1992 Election:
- S&P 500 Performance: Up 1.9%
- Prediction: Incumbent Republican President George H.W. Bush should have won
- Outcome: Democratic challenger Bill Clinton won
2020 Election:
- S&P 500 Performance: Up 4.6%
- Prediction: Incumbent Republican President Donald Trump should have won
- Outcome: Democratic challenger Joe Biden won
It is important to note that all errors made by the stock market predictor were false positives, where the model incorrectly predicted an incumbent win when the incumbent actually lost. The predictor tends to overestimate the likelihood of the incumbent party winning when the market is up. No instances of false negatives suggest that when the market was down, the predictor accurately anticipated incumbent losses.
Why the Stock Market Reflects Voter Sentiment
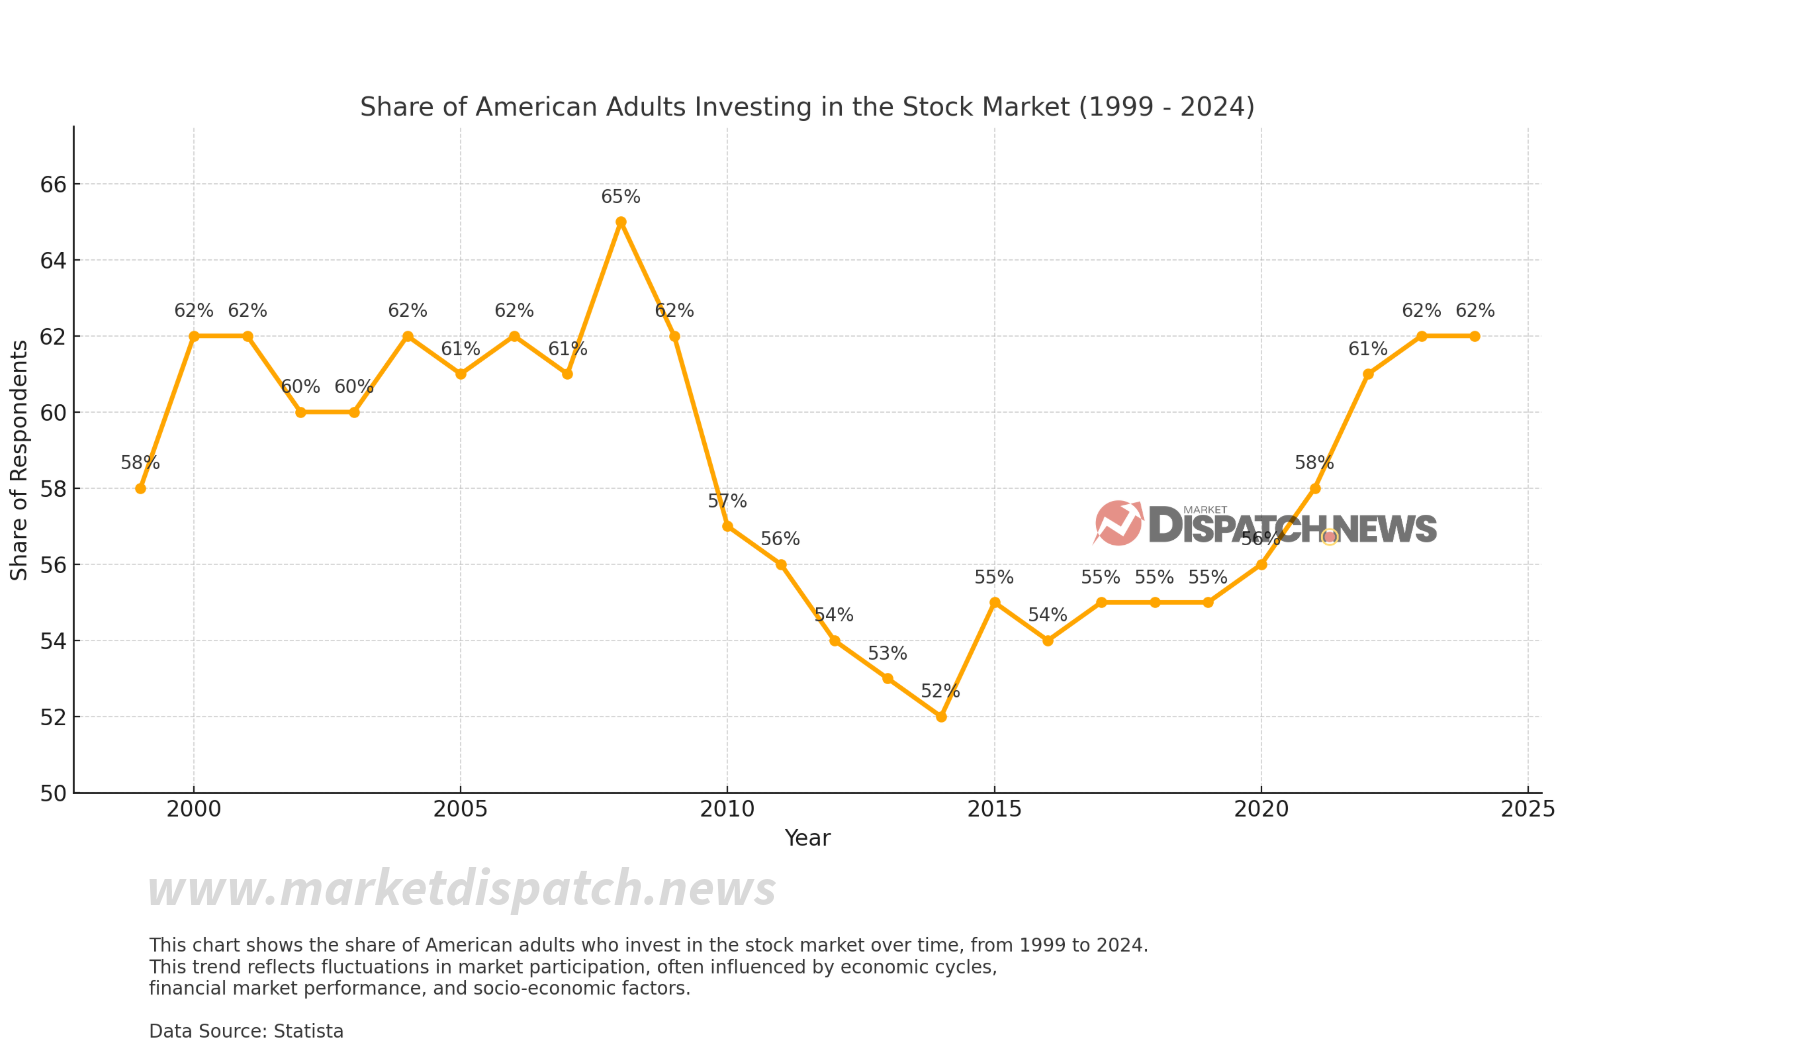
As the saying goes, people vote with their wallets. Despite ideals and promises by which candidates center campaigns, much of the voting public makes a binary decision around the economy, and more specifically based on how wealthy they feel. With net American household stock holding near an all-time high, consumers have never been more exposed to the performance of the stock market than today. The stock market also serves as an interesting expectations gauge, as rising index levels indicate economic optimism, a kind of optimism that is actually being wagered, unlike sentiment surveys and consumer opinion polls.
An interesting wrinkle in this also centers around the economic climate. My analysis further found that voters are much more likely to exhibit preference for a change in party regime when economic conditions are tough. The Misery Index, which takes a composite of the inflation rate and unemployment rate, can tell us how poor voters feel about the economy.
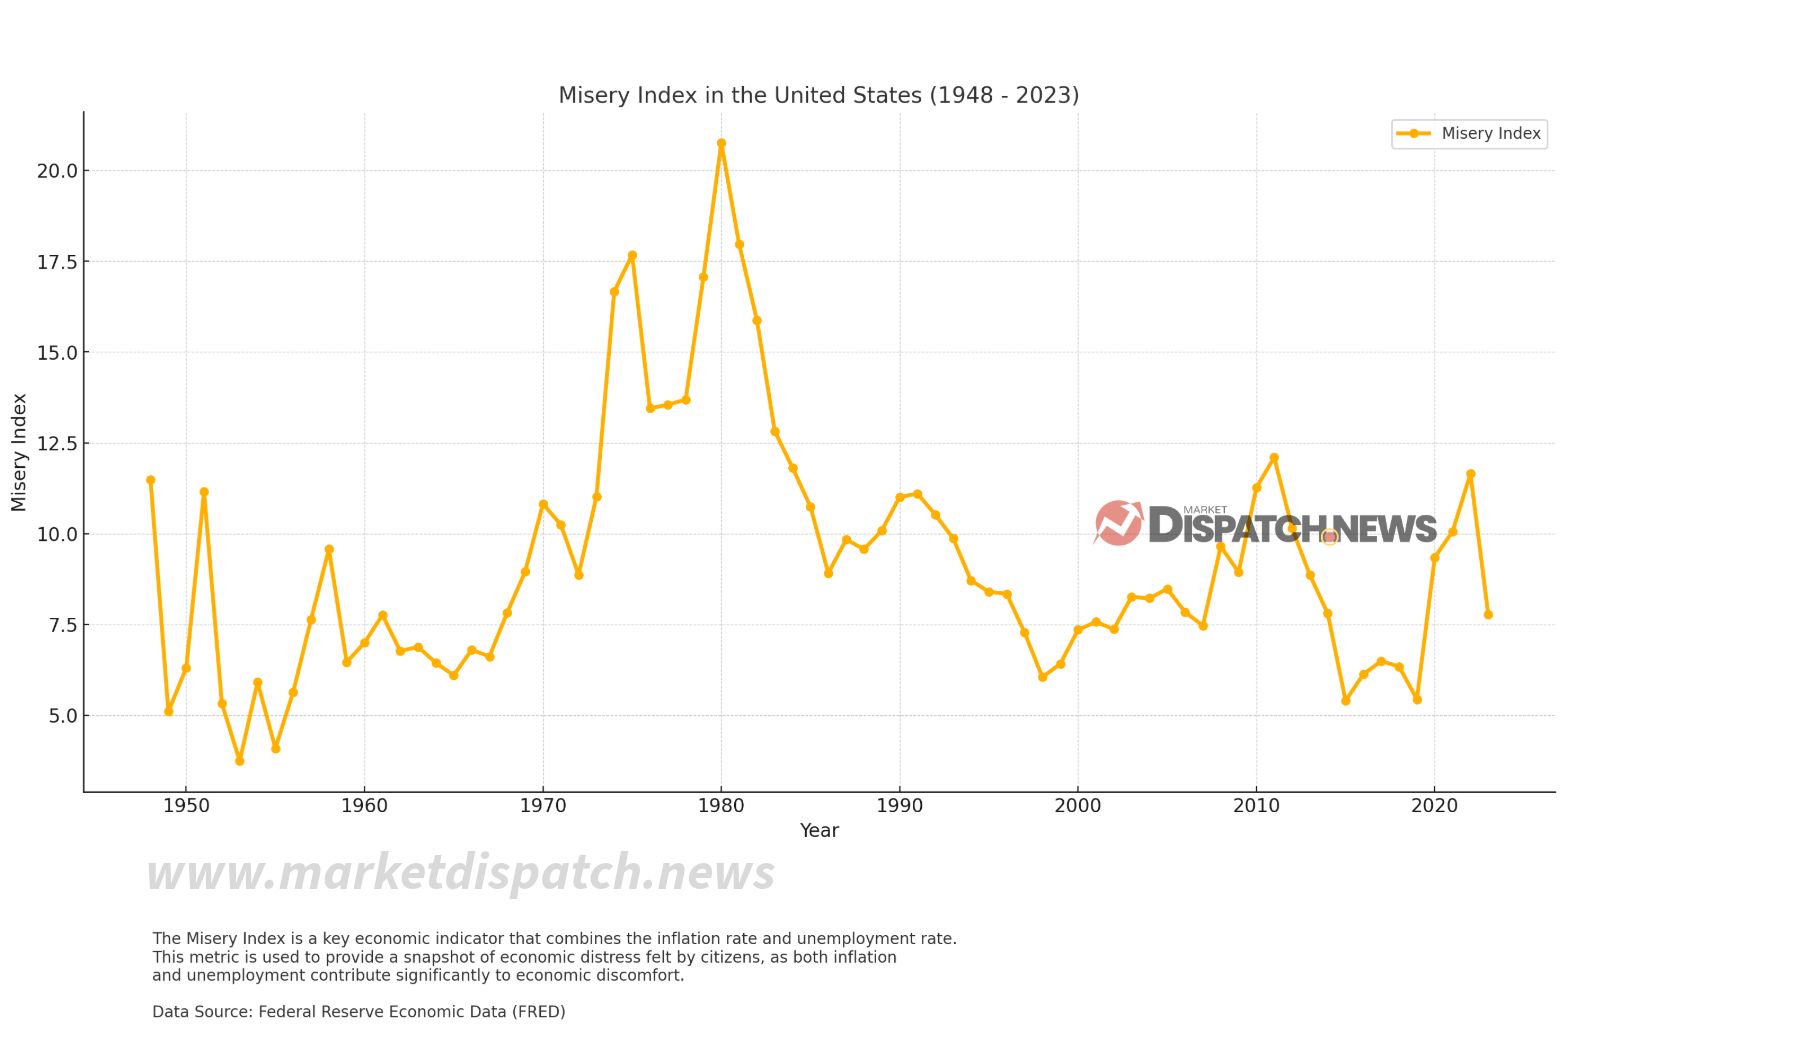
Values above 10% have been strongly correlated with party changes, while the indicator loses its predictive ability at lower levels. Combining the two, in instances where the stock market indicator was incorrect, I find that the misery index prediction was correct, or vice versa. Starting in 1948, when the misery index first became widely published, the combined predictive record scored 18/19 for a 94.7% win rate. Only once (in 1984) did the combined indicator fail to predict a loss for the incumbent party.
Still here?
Combined Misery Index and Stock Market Prediction Table
Analyzing Combined Predictive Power from 1948 to 2020
| Year | Misery Index % | Misery Index Prediction | S&P 500 Performance % Change | Stock Market Prediction | Actual Outcome | Combined Prediction | Prediction Correct? |
|---|---|---|---|---|---|---|---|
| 1948 | 6.8 | Incumbent Wins | 5.0% | Incumbent Wins | Incumbent Won | Incumbent Wins | Yes |
| 1952 | 4.3 | Incumbent Wins | -3.3% | Incumbent Loses | Incumbent Lost | Incumbent Loses | Yes |
| 1956 | 6.1 | Incumbent Wins | 0.9% | Incumbent Wins | Incumbent Won | Incumbent Wins | Yes |
| 1960 | 7.0 | Incumbent Wins | -0.7% | Incumbent Loses | Incumbent Lost | Incumbent Loses | Yes |
| 1964 | 6.8 | Incumbent Wins | 2.6% | Incumbent Wins | Incumbent Won | Incumbent Wins | Yes |
| 1968 | 8.8 | Incumbent Wins | -4.0% | Incumbent Loses | Incumbent Lost | Incumbent Loses | Yes |
| 1972 | 7.4 | Incumbent Wins | 3.0% | Incumbent Wins | Incumbent Won | Incumbent Wins | Yes |
| 1976 | 12.7 | Incumbent Loses | 5.5% | Incumbent Wins | Incumbent Lost | Incumbent Loses | Yes |
| 1980 | 20.7 | Incumbent Loses | -4.2% | Incumbent Loses | Incumbent Lost | Incumbent Loses | Yes |
| 1984 | 11.8 | Incumbent Loses | 8.4% | Incumbent Wins | Incumbent Won | Incumbent Loses | No |
| 1988 | 9.6 | Incumbent Wins | 1.9% | Incumbent Wins | Incumbent Won | Incumbent Wins | Yes |
| 1992 | 10.5 | Incumbent Loses | 1.9% | Incumbent Wins | Incumbent Lost | Incumbent Loses | Yes |
| 1996 | 8.5 | Incumbent Wins | 8.2% | Incumbent Wins | Incumbent Won | Incumbent Wins | Yes |
| 2000 | 7.4 | Incumbent Wins | -4.3% | Incumbent Loses | Incumbent Lost | Incumbent Loses | Yes |
| 2004 | 8.8 | Incumbent Wins | 2.2% | Incumbent Wins | Incumbent Won | Incumbent Wins | Yes |
| 2008 | 9.6 | Incumbent Wins | -19.5% | Incumbent Loses | Incumbent Lost | Incumbent Loses | Yes |
| 2012 | 9.6 | Incumbent Wins | 2.5% | Incumbent Wins | Incumbent Won | Incumbent Wins | Yes |
| 2016 | 6.7 | Incumbent Wins | -1.9% | Incumbent Loses | Incumbent Lost | Incumbent Loses | Yes |
| 2020 | 15.1 | Incumbent Loses | 4.6% | Incumbent Wins | Incumbent Lost | Incumbent Loses | Yes |
Summary Statistics for Combined Misery Index and Stock Market Prediction Table
- Total Elections Analyzed: 19 (from 1948 to 2020)
- Combined Predictor Correct Predictions: 18 out of 19
- Accuracy Rate: Approximately 94.7%
Comparison with Individual Predictors
Stock Market Predictor Alone:
- Correct Predictions: 16 out of 19
- Accuracy Rate: Approximately 84%
- Incorrect Predictions: 1976, 1992, 2020
Misery Index Predictor Alone:
- Correct Predictions: 12 out of 19
- Accuracy Rate: Approximately 63%
- Incorrect Predictions: 1952, 1960, 1968, 1984, 2000, 2008, 2016
Key Observations
Enhanced Predictive Accuracy: By combining both indicators, the overall accuracy improved to 94.7%, correctly predicting 18 out of 19 elections.
Disagreements Between Indicators: In elections where the two indicators provided conflicting predictions, the combined prediction was correct in all cases except for 1984. In all instances of false positive given by the stock market predictor, the Misery Index predictor gave the correct prediction. From a confidence standpoint, I believe this greatly increases the validity of the combined prediction mechanism.
Exception Analysis: 1984 Election
- Misery Index Prediction: Incumbent Loses (Misery Index > 10%)
- Stock Market Prediction: Incumbent Wins (Market was up)
- Actual Outcome: Incumbent President Ronald Reagan won re-election
- Combined Prediction: Incumbent Loses
2024 Election Forecast: What Market Trends Suggest
As polls open and votes begin to be counted, a quick look at the market indicators gives the following data:
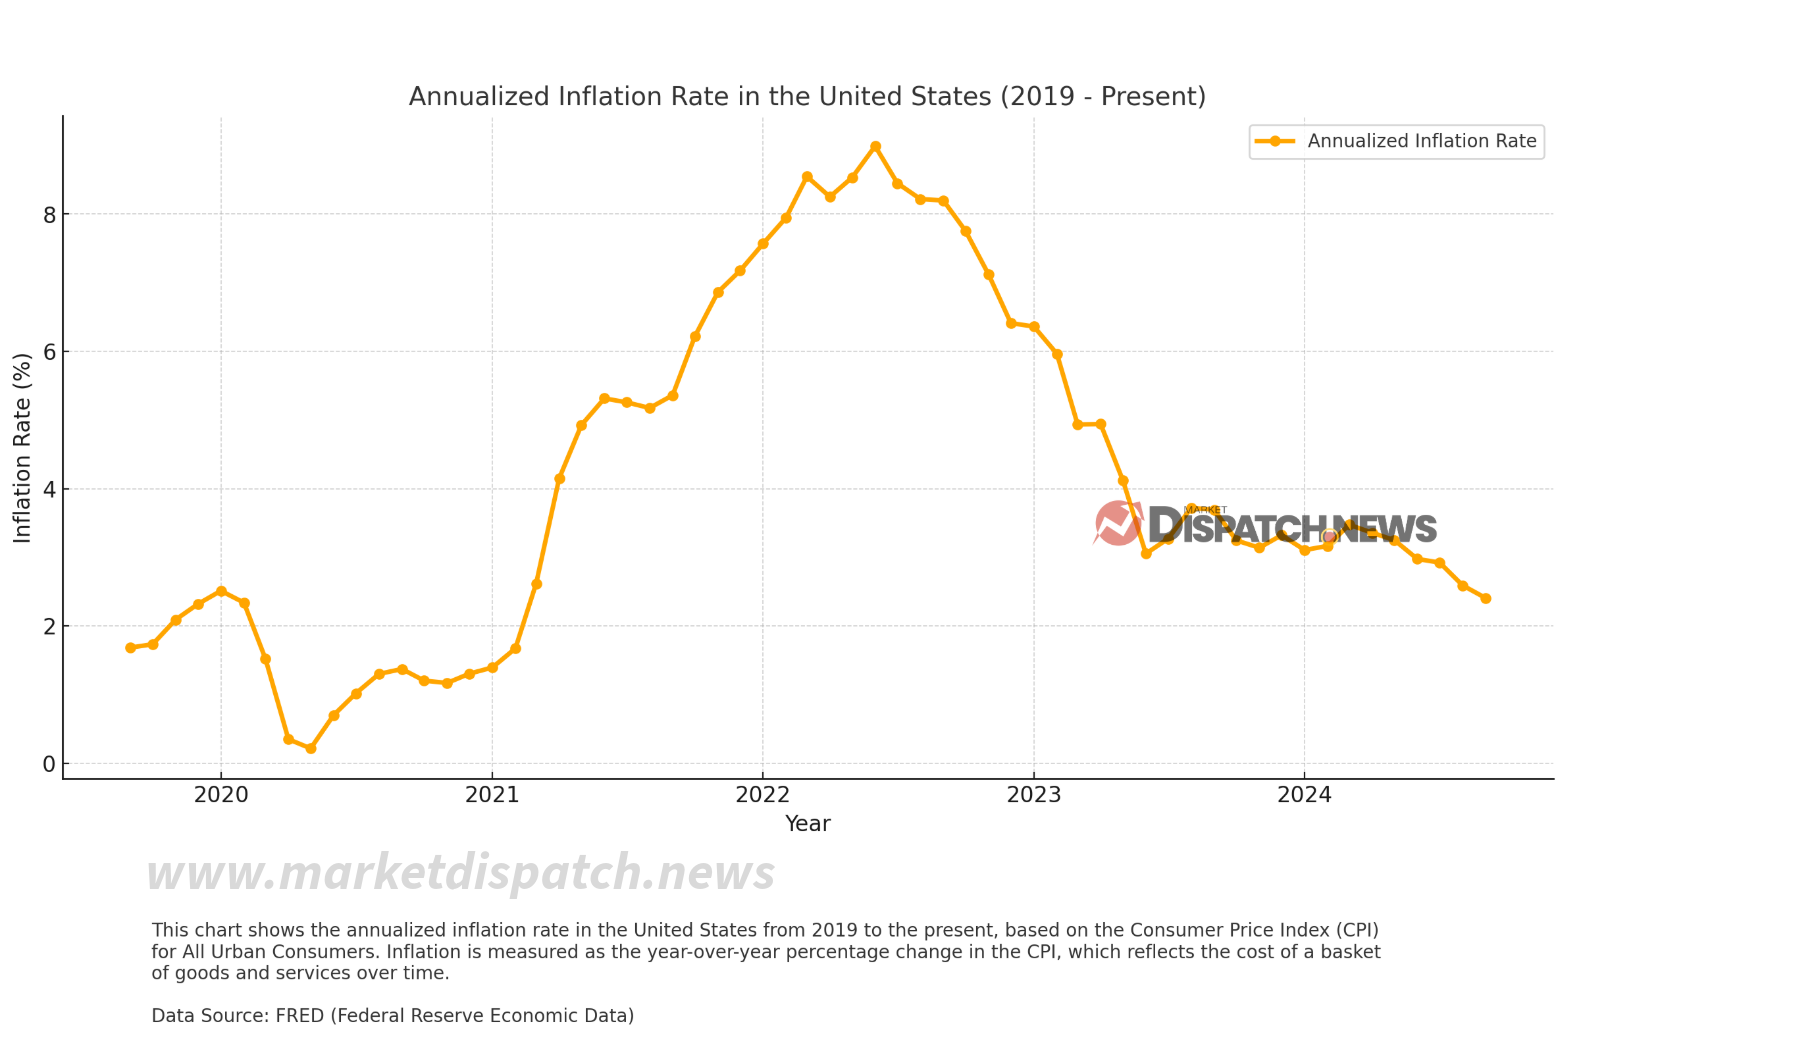
- Current inflation rate: 2.41%
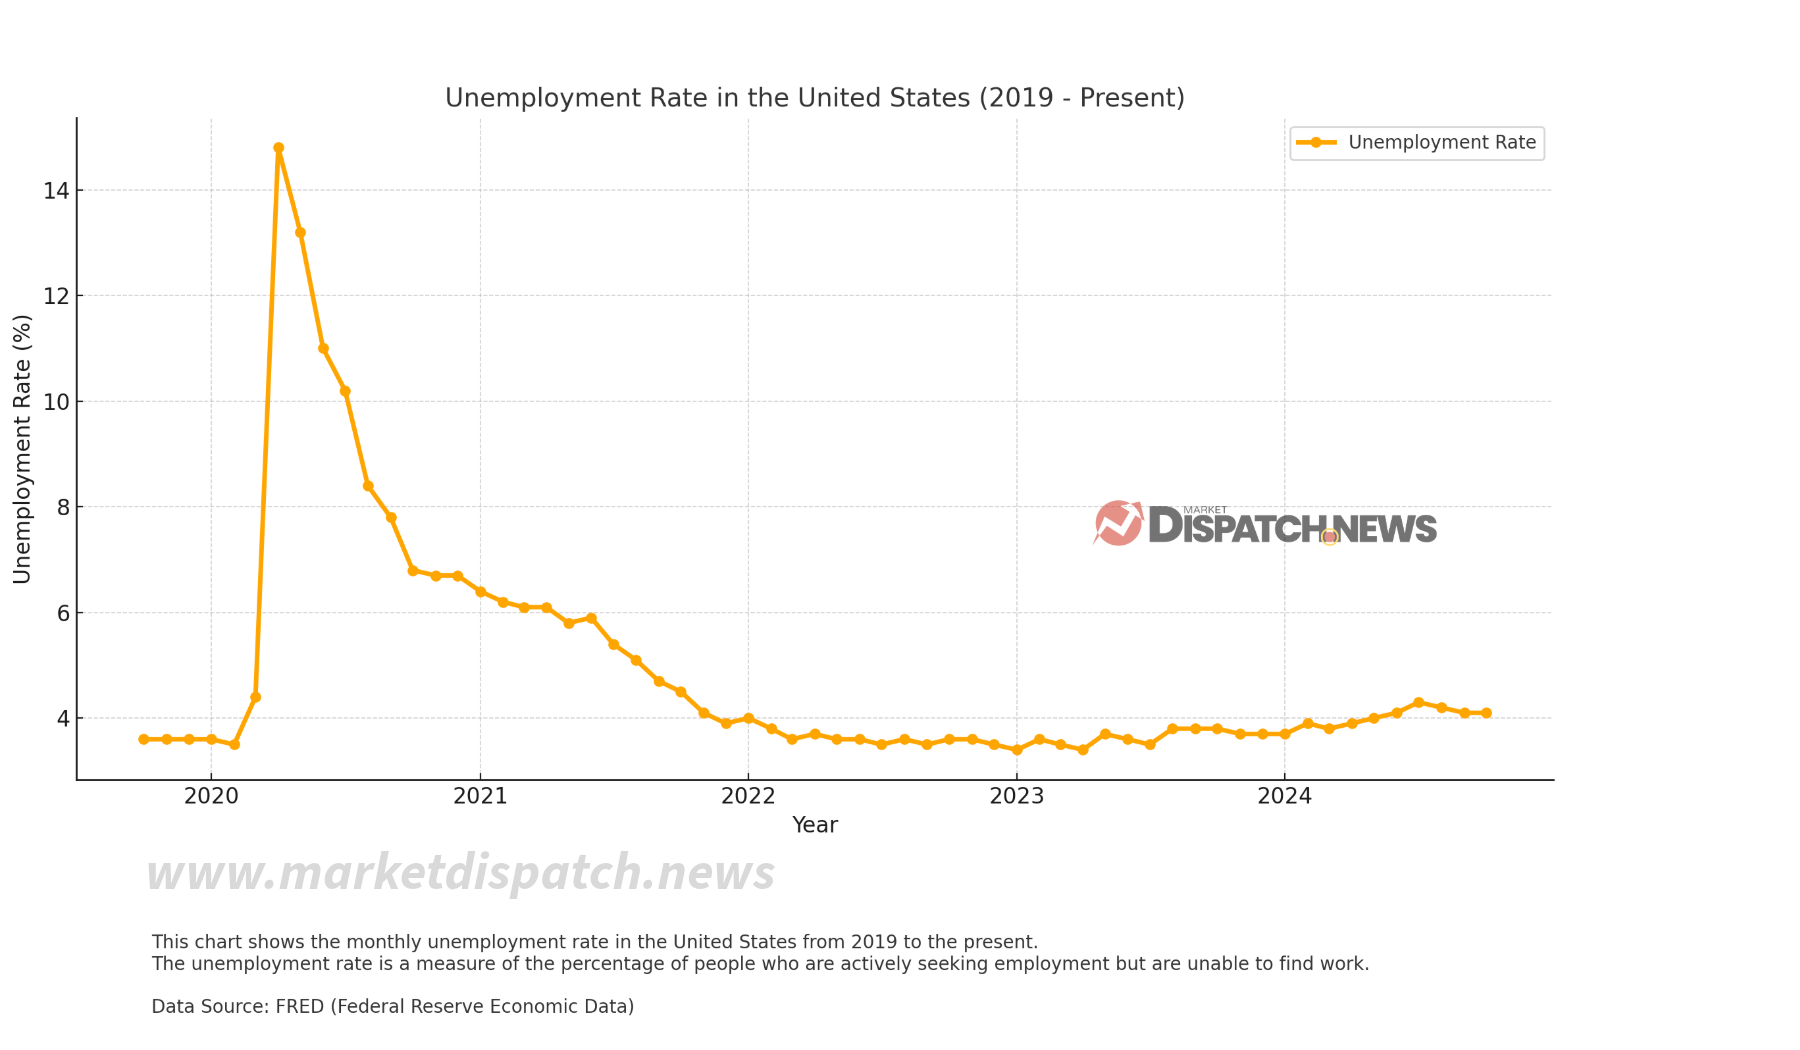
- Current seasonally adjusted unemployment rate: 4.1%
- S&P 500 trailing 3 month performance: +8.02%
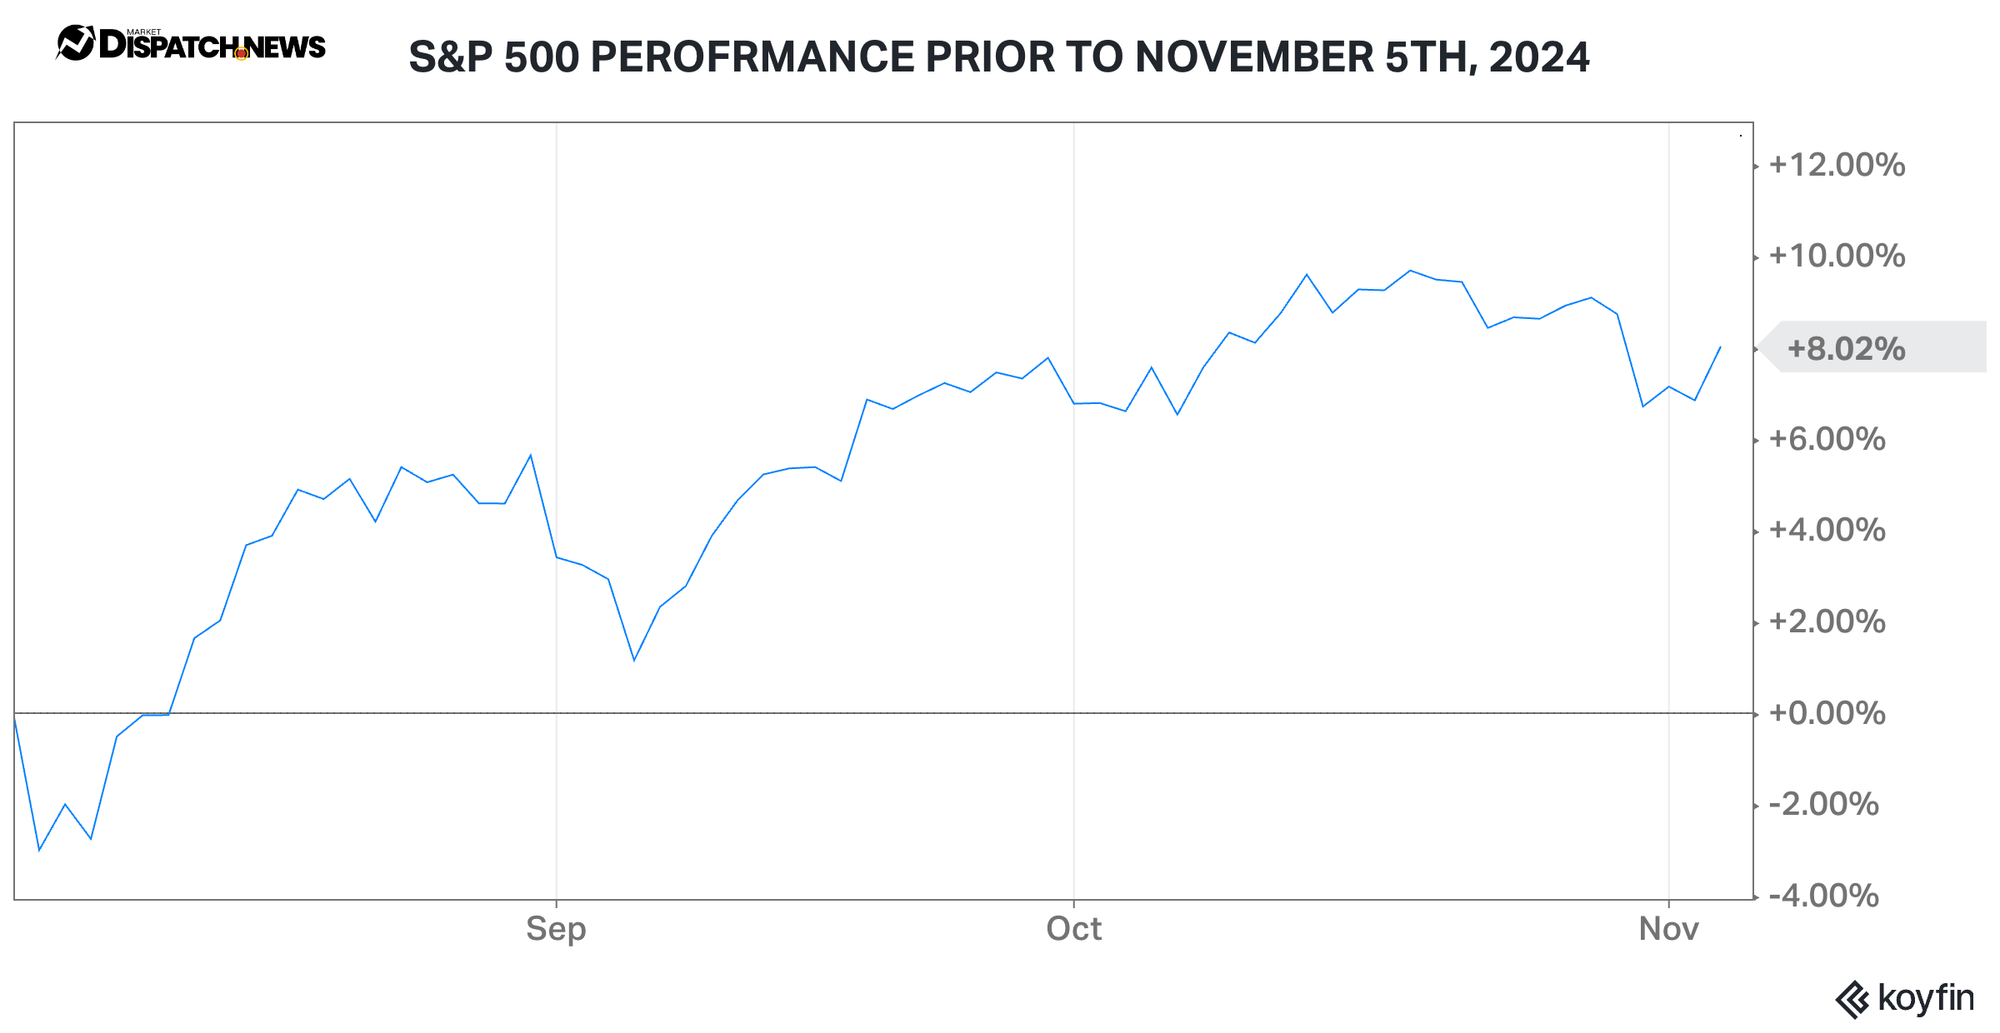
- Misery index: 6.51% (lower than 85% of total observed values)
With neither indicator giving prediction of a party switch in the White House, I make the prediction with a high level of confidence that VP Harris will obtain the 270 electoral college votes to secure the presidency.
Limitations of the Stock Market as a Predictive Tool
As with all backward-looking prediction engines, this model suffers from the possibility of hindsight bias. Past events are no guarantee that the future will continue to be that way. Every day, Americans are doing the ugly and sometimes problematic work of trying to destruct systems and methodologies we think are incorrect. From the mere calculation of inflation metrics to the integrity of our voting machines, things do not go by without question. I must recognize the possibility that the inputs conceiving this model are fundamentally flawed or have been altered in some way.
I must also recognize the largest underlying or lurking variable in my analysis. As the saying goes, correlation does not equal causation, and using this model to predict election outcomes moves from the former to the latter. More importantly however, I must recognize that there may be a natural tendency for the things my models identify to happen by themselves without impact from one another.
Lastly, I must recognize that most of the time, the United States stock market goes up. Most of the time, an incumbent president has served 8 years and can no longer run again. Most of the time, the opposing party has had plenty of time to work up a new attack plan. The combination of a new candidate for the incumbent party and a returning candidate who hasn't served consecutive terms means we may truly be in uncharted waters.
A Final Word
Is it perfect? No. Could it be totally wrong later today? Perhaps. Do I still feel confident enough to issue a prediction, especially one that is grounded by arguably the most important free marketplace in human history? Yes.
I wrote this piece to get views and hopefully play probabilities to being right in hindsight. Adjusting for a level of uncertainty in the model, I'd give Kamala Harris a 75% chance of victory today. That's all I'll speak on it. Feel free to circle back here and remind me if I was wrong, but until then, remember:
Buy U.S. Stocks and never sell them.
To check back in and follow along as I continue to build the first financial wellness and education company in America.
I'll see you back here very soon, as always, in the Market Dispatch.


Comments ()